Spark Jam 2026 · Best Framer User
Monthly Financial Wrap
An interactive dashboard that makes a month of spending readable at a glance.
- Role
- Data cleaning, design, prototyping
- When
- 2026
- Tools
- Framer · Figma · Excel · UX/UI
The idea
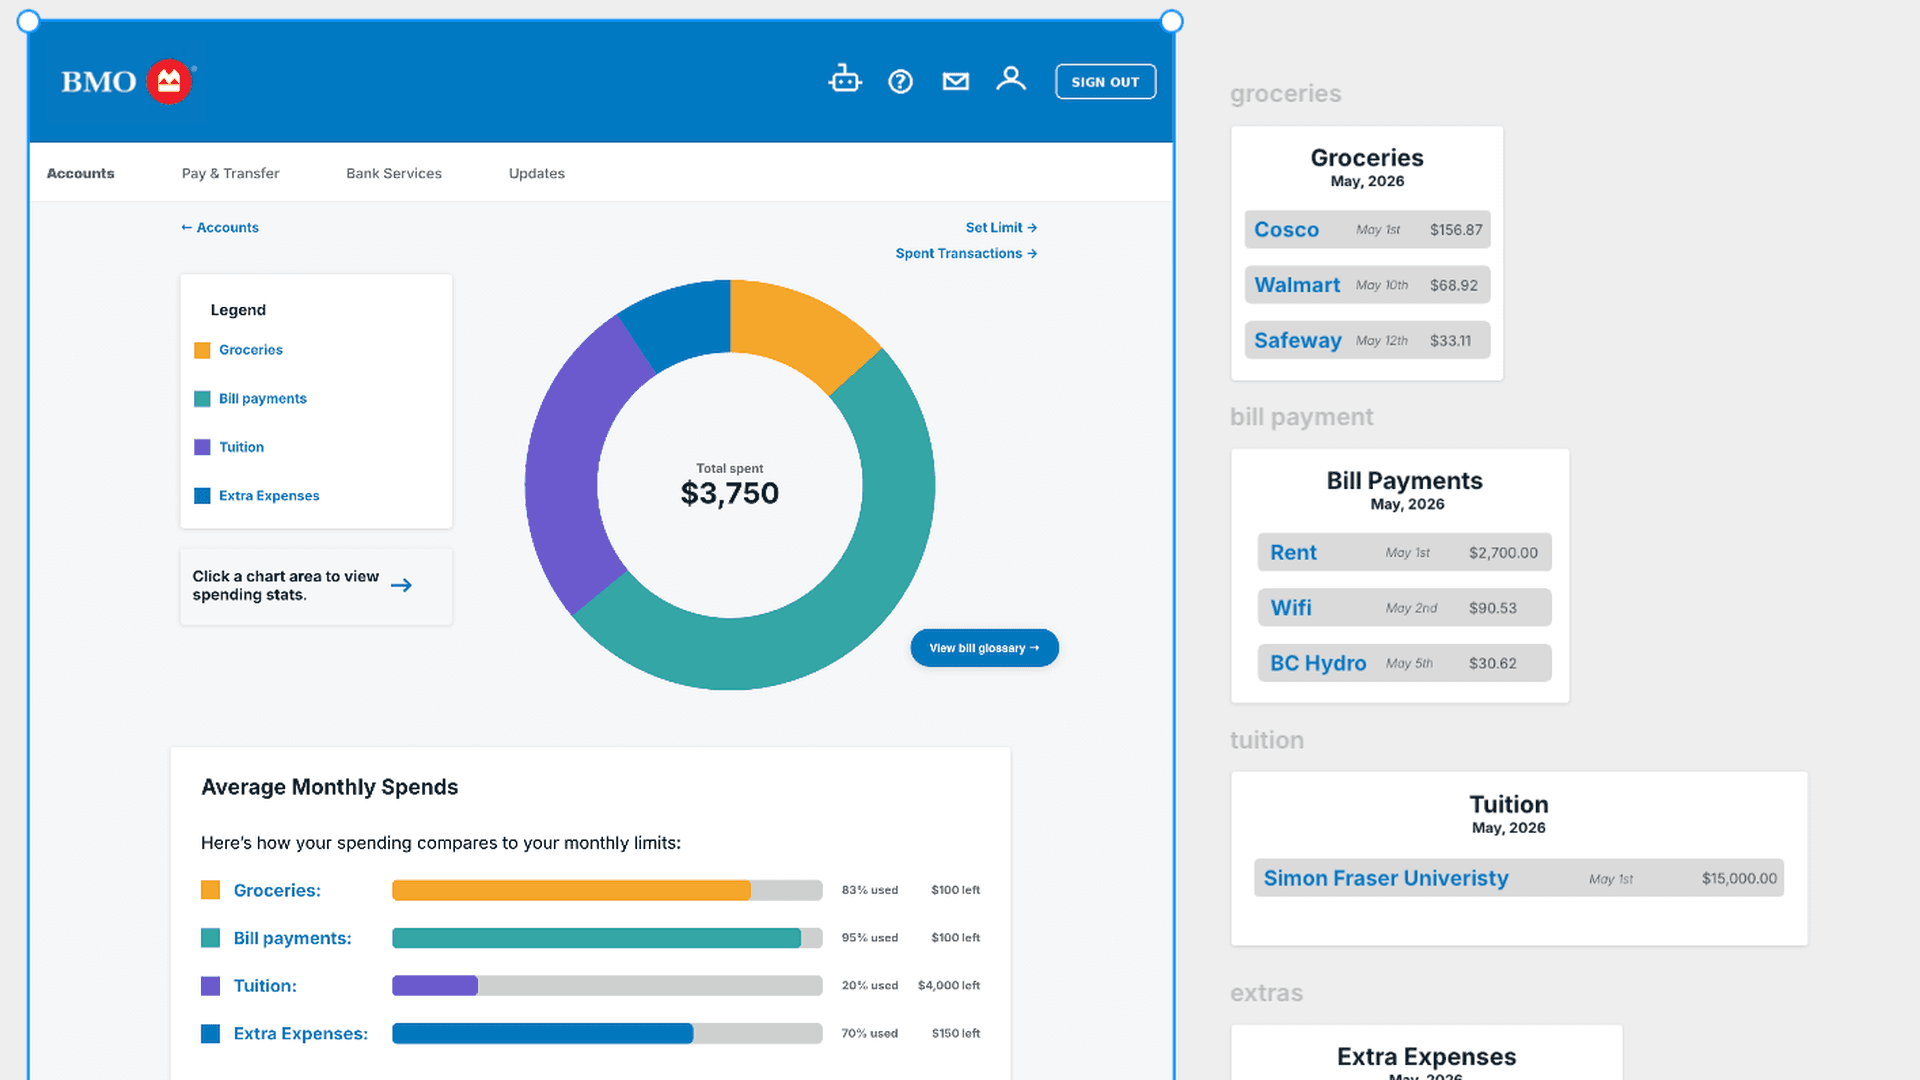
Built for Spark Jam 2026. The goal was to take a month of raw spending data and turn it into something a person could actually understand in a few seconds, rather than a spreadsheet they would avoid opening.
What I did
- Cleaned and structured a month of spending data in Excel
- Analyzed the financial activity to find the patterns worth surfacing
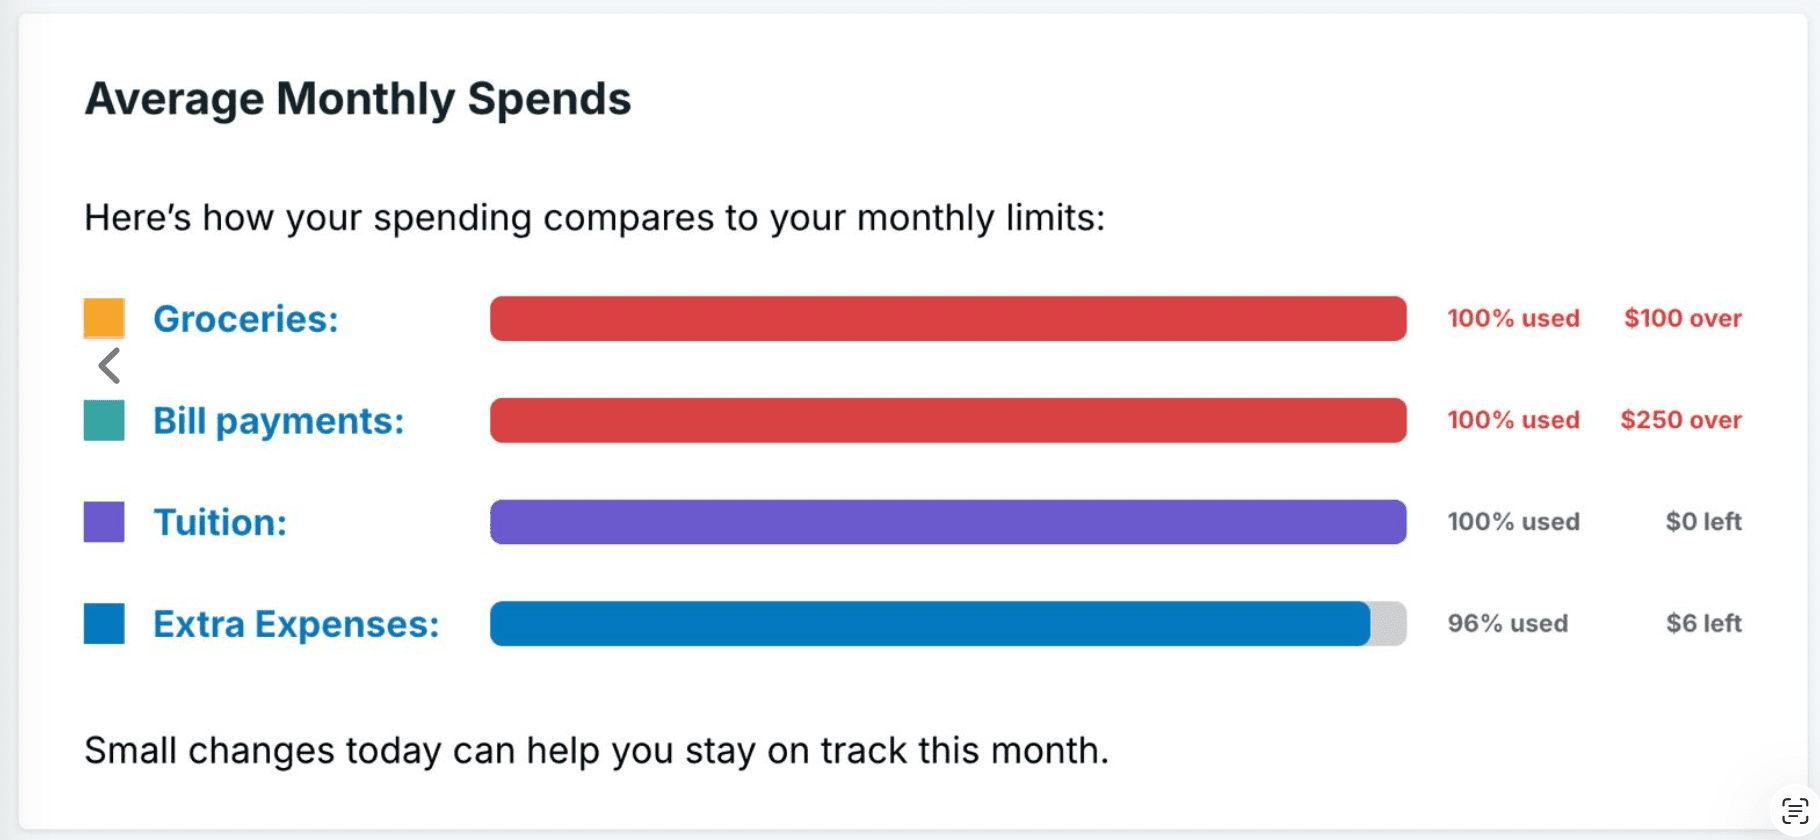
- Designed an interactive dashboard around those patterns
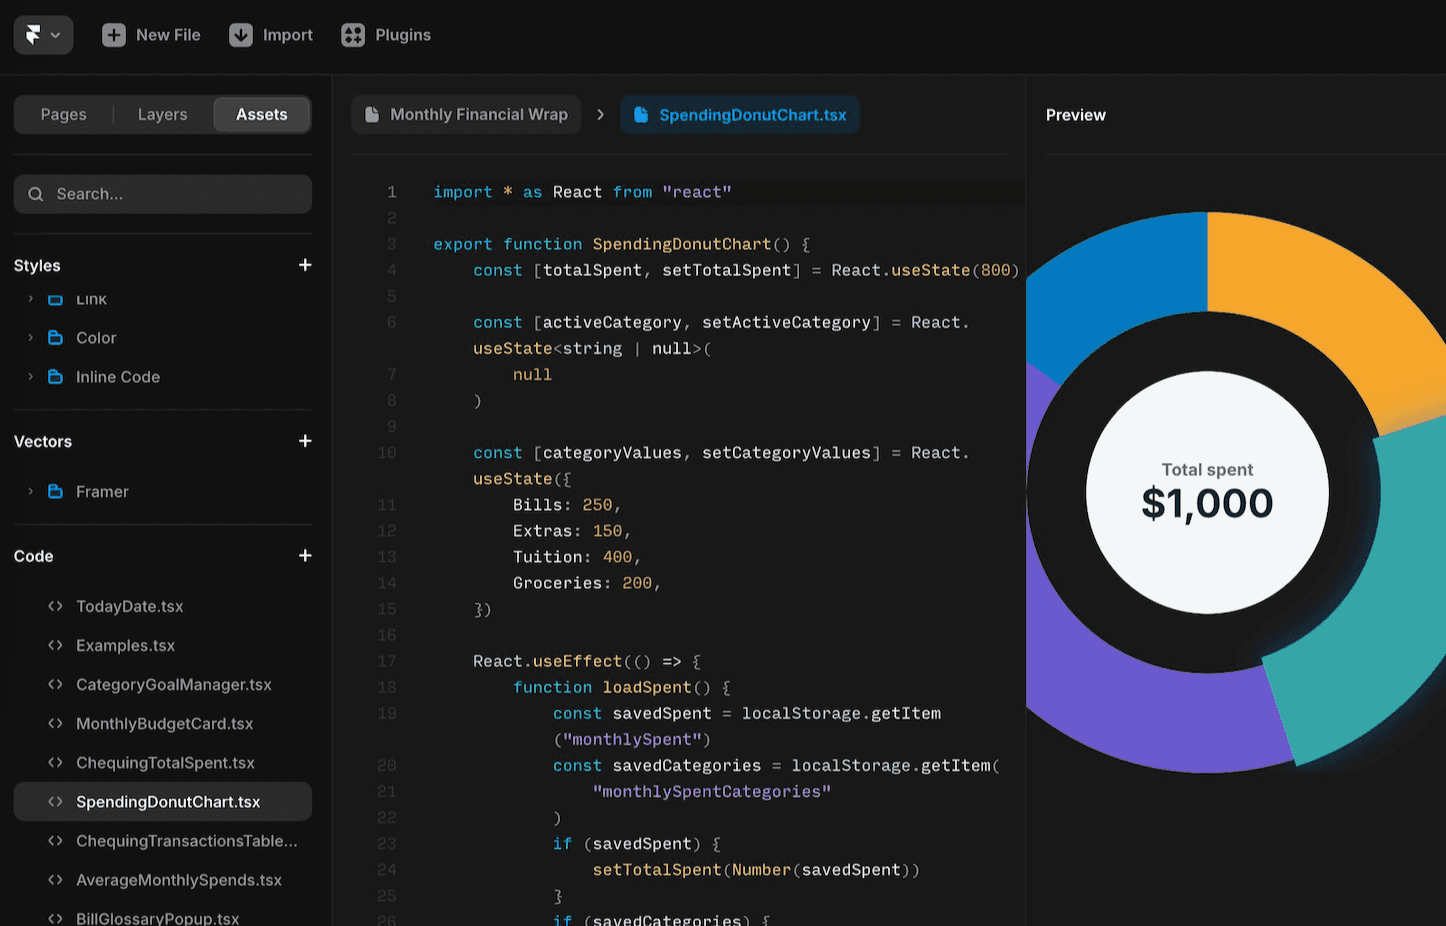
- Prototyped the full experience in Figma and Framer
Recognized as Best Framer User at Spark Jam 2026.